| Unlocking the Potential of Multimodal Learning in Predictive Modeling | |||
| Evaluating the effectiveness of different methods for integrating unstructured data into predictive models. | |||
| Author: Max Poff | Published: December 10th, 2024 |
Methodology
Dataset
The House Prices and Images (SoCal) dataset was chosen as a testbed for this study. Comprising 15,473 properties, each entry includes structured tabular data—such as the number of bedrooms, bathrooms, and total square footage—alongside a single high-quality exterior image of the property. The dataset is representative of a variety of homes in Southern California, capturing a range of architectural styles, sizes, and conditions. This variety allows for a robust evaluation of different data integration strategies.
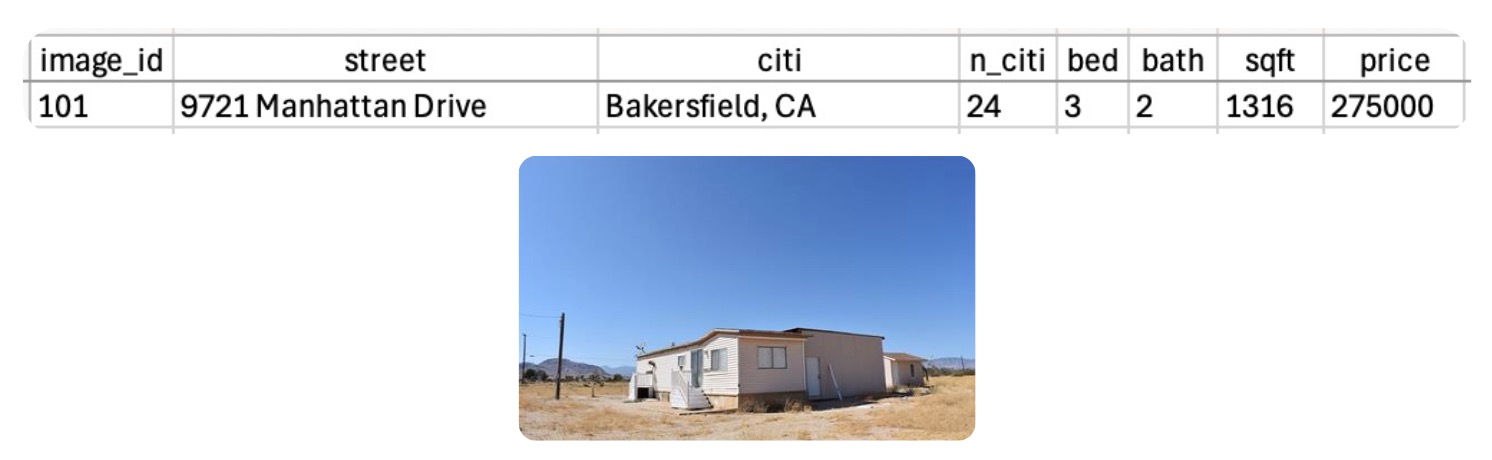
Figure 1: Example datapoint from the dataset.
Approaches Evaluated
Two distinct methods were implemented and compared to integrate image data into a predictive pipeline:
- End-to-End Multimodal Neural Network:
A direct, “naive” approach that feeds the raw house image and the structured tabular data into a neural network. The network learns to extract features from both modalities simultaneously and produce a single numeric output: the predicted sale price. - Embedding Descriptions of Images:
A more indirect yet flexible approach that uses a vision-language model to generate natural language descriptions of each image. These descriptions are then converted into numeric embeddings. These text-based embeddings, now acting as a high-level, compressed representation of the image content, are concatenated with the tabular data. Conventional regression methods (e.g., XGBoost or Lasso) are then applied to this enriched feature space.
1. End-to-End Multimodal Neural Network
The end-to-end multimodal neural network approach attempts to directly leverage the raw image in combination with structured tabular features to predict the property’s sale price. The architecture is summarized in the figure below and can be conceptually broken down into three parts: the image feature extractor, the tabular feature processor, and concatenation followed by regression layers to produce the final prediction.
Architecture Details:
Image Feature Extraction:
We begin with a pretrained ResNet-18, a classic and well-known convolutional neural network originally designed for image classification tasks. In this study, the ResNet-18 model is truncated by removing its final fully connected layer, effectively using it as a fixed feature extractor. All parameters of ResNet-18 are kept frozen, relying on its ImageNet pretraining to provide a robust initial representation of the house images.
The output from the ResNet-18 after global average pooling is a 512-dimensional vector that encodes high-level visual features from the image, such as the shape and color of the property’s exterior, roof type, window style, lawn condition, and other visual cues that might influence price.
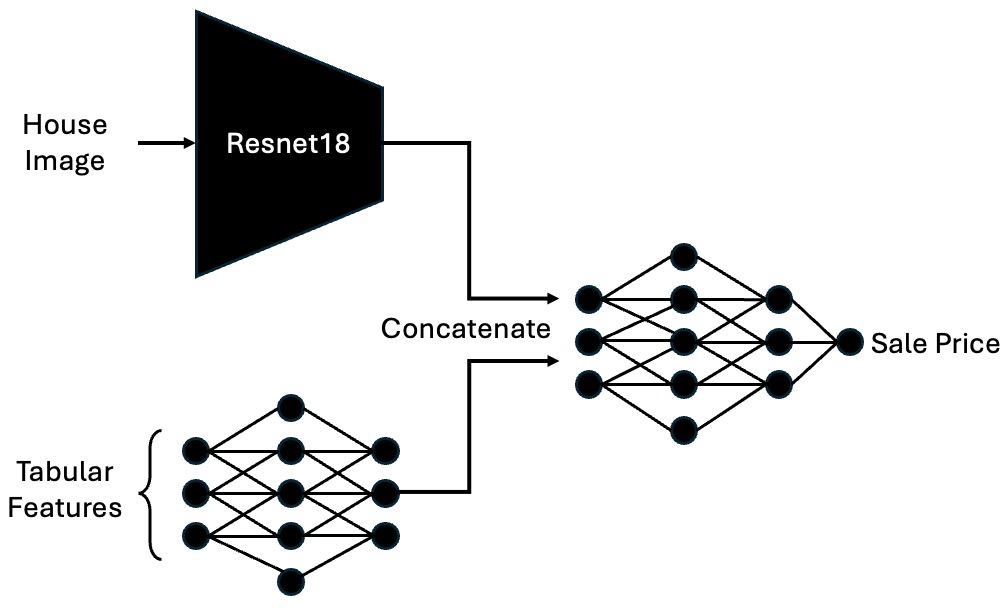
Figure 2: End-to-end neural network architecture.
Tabular Feature MLP:
The structured data includes features like the number of bedrooms, bathrooms, square footage, and one-hot encoded categorical variables (e.g., city indicators). After one-hot encoding and ensuring all features are numeric, this results in a 418-dimensional vector of tabular inputs for each property.
- Input: 418 features
- Hidden Layer 1: 1024 neurons with ReLU activation
- Hidden Layer 2: 512 neurons with ReLU activation
- Hidden Layer 3: 256 neurons with ReLU activation
- Hidden Layer 4: 128 neurons with ReLU activation
The MLP transforms the raw tabular data into a 128-dimensional latent representation that captures the underlying patterns and interactions between different structured attributes.
Feature Fusion and Regression Layers:
After obtaining the 512-dimensional vector from ResNet-18 and the 128-dimensional vector from the tabular MLP, these two representations are concatenated, forming a joint 640-dimensional feature vector.
This fused vector is then passed through additional fully connected layers designed for regression:
- Input: 640 features
- Hidden Layer 1: 256 neurons with ReLU activation
- Hidden Layer 2: 128 neurons with ReLU activation
- Output Layer: 1 neuron (representing the predicted sale price)
Training Procedure:
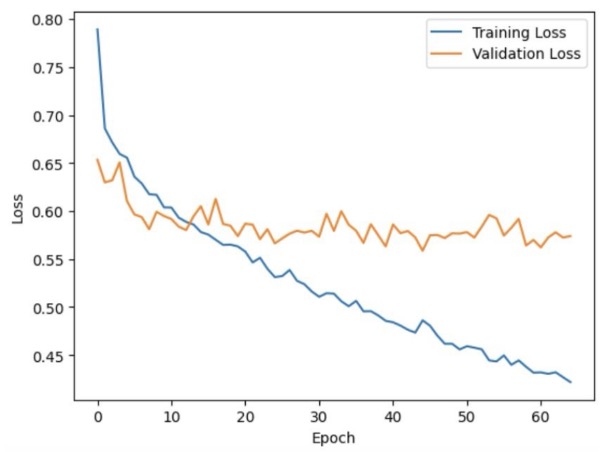
The training loop uses an MSE (Mean Squared Error) loss between the predicted and actual sale prices. An Adam optimizer (with a learning rate of 3e-4) is employed for parameter updates. The training runs for 40 epochs, with early validation steps to monitor performance and prevent excessive overfitting.
By the end of training, the model converges to a stable loss level, as observed in the training and validation curves in Figure 3 below. Test performance of this model is discussed in the Results section.
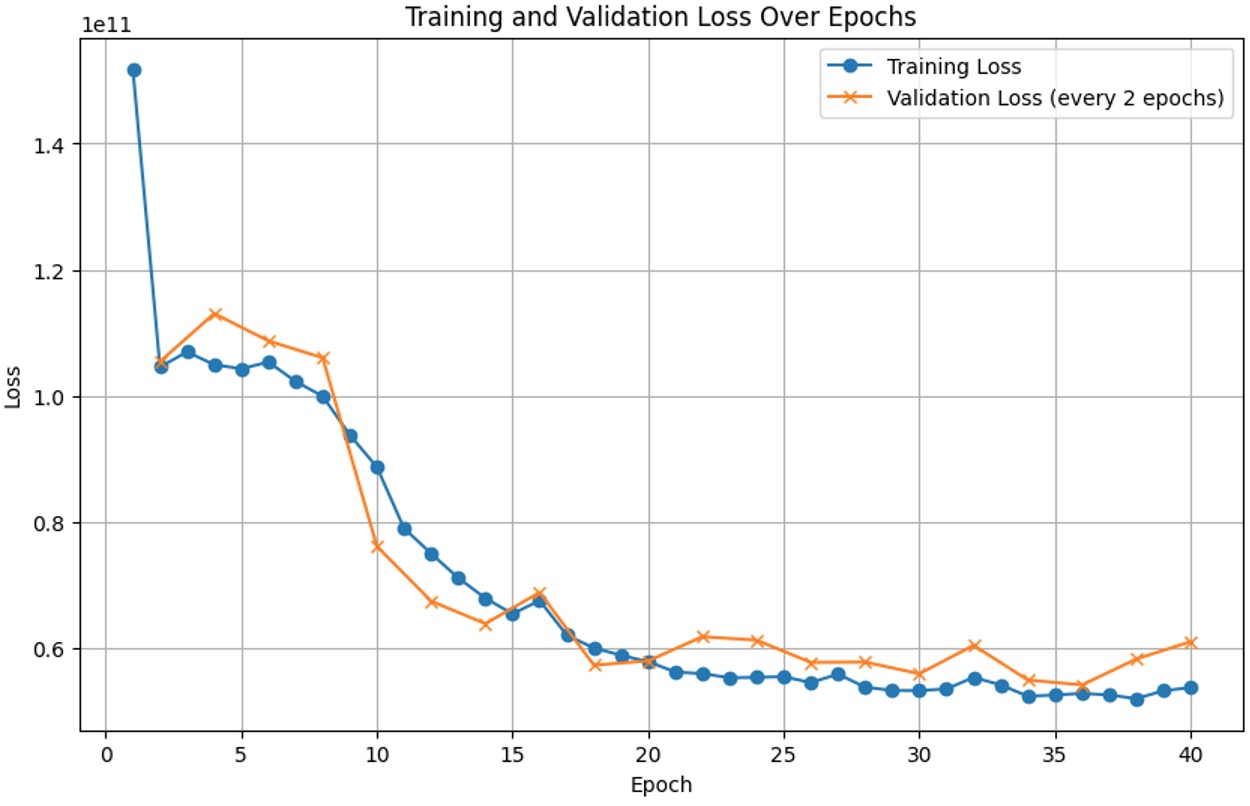
Figure 3: Training and Validation Loss Curves.
2. Embedding AI-Generated Descriptions of Images
The second method replaces the direct incorporation of images with a more interpretable and flexible approach. Instead of passing raw image pixels to a CNN, we rely on a vision-language model to produce text descriptions of the image. The rationale is that language-based models, like GPT-4o-mini, can abstract visual content into semantically meaningful textual embeddings. These textual representations may highlight features that directly influence price—architectural style, visible property conditions, curb appeal, yard size, or neighborhood hints—without requiring the network to learn these associations from scratch. This process is shown below in Figure 4

Figure 4: Embedding text description with VLM.
Procedure:
1. Text Generation:
For each property image, GPT-4o-mini is prompted with a fixed text prompt. Several prompts were tested:
- Prompt 1 (Broad): “Describe this image.”
- Prompt 2 (Specific): “Analyze the provided image of a home and identify visual characteristics, features, and details that might influence its sale price. Focus on aspects not captured by tabular data (...)"
- Prompt 3 (Sentimental): A creative, narrative-based prompt aimed at eliciting subjective reactions.
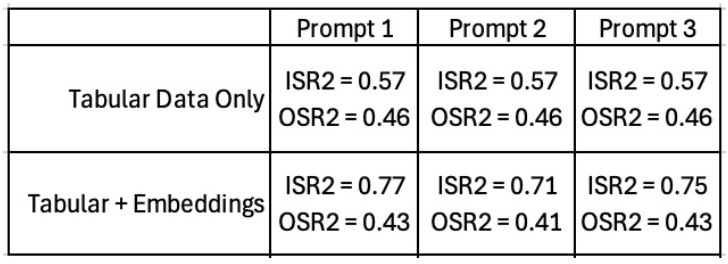
Table 1: Prompt Results.
2. Text Embeddings:
Each description is then embedded into a 3072-dimensional vector using OpenAI’s text-embedding-3-large model. This transforms the textual descriptions into dense numerical representations that can be easily concatenated with the tabular data.
3. Dimensionality Reduction:
Adding 3,000+ embedding features can lead to overfitting. To mitigate this, two dimensionality reduction techniques were tested:
- PCA (Principal Component Analysis): Reduced embeddings to 64 dimensions. PCA retains the directions of maximum variance and often helps improve model generalization.
- Neural Network Reduction: Trained a separate MLP to predict price from the 3072-dimensional embeddings and used the last hidden layer (64 neurons) as compressed features, as shown below.
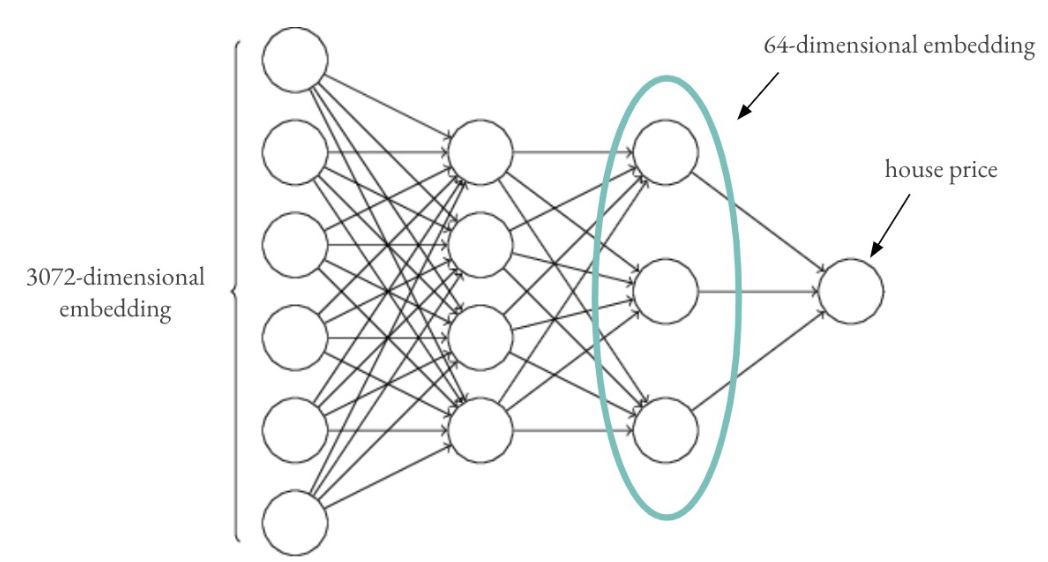
Figure 5: Neural Network Dimensionality Reduction.
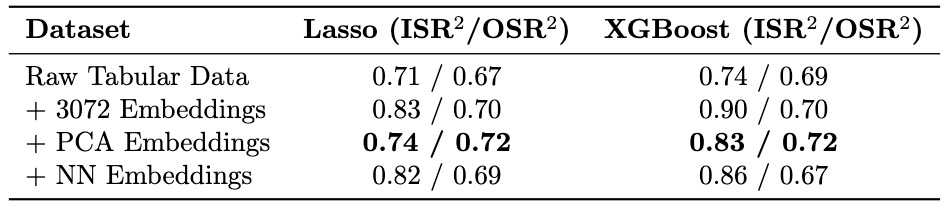
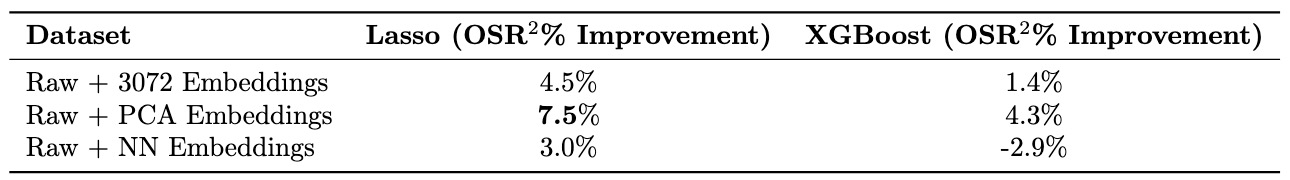
4. Regression Methods:
After dimensionality reduction, these embeddings were appended to the tabular features, and standard regression models like Lasso and XGBoost were trained on this enriched feature set. The rationale is that these simpler models, given semantically meaningful low-dimensional embeddings, may outperform a more complex end-to-end neural network that must learn low-level representations on its own.